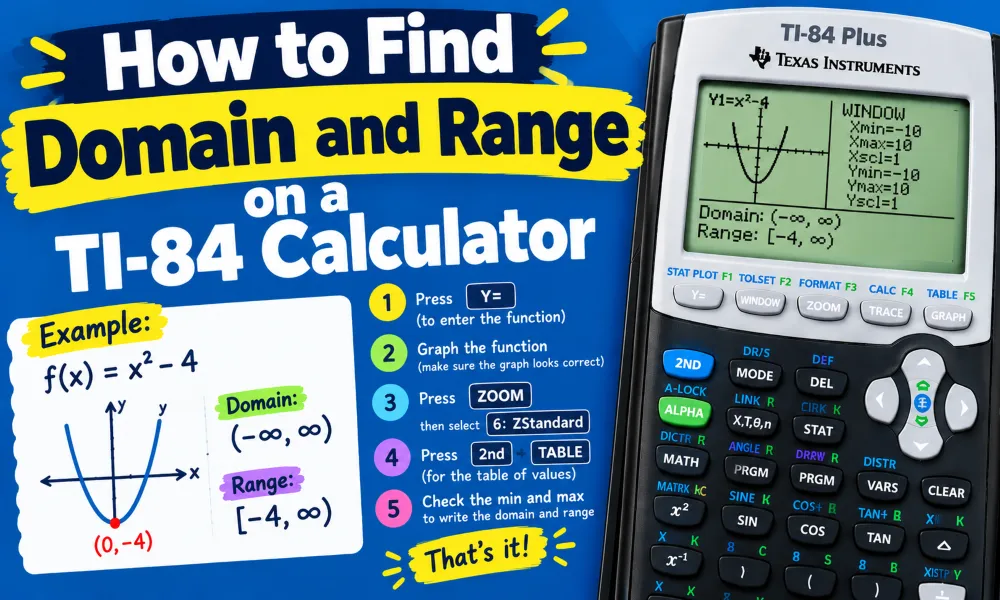
Finding the domain and range on a TI-84 calculator becomes much easier when you know how to use the graphing window, table, and trace functions. The TI-84 does not have one dedicated button that automatically displays the domain and range of every function. Instead, you can use the graph and table to identify the x-values and y-values that belong to a function.
The domain represents all possible x-values for a function. The range represents all possible y-values. Some functions have a domain and range that extend from negative infinity to positive infinity. Other functions have restrictions caused by square roots, denominators, logarithms, endpoints, or other features.
This guide explains how to find domain and range on a TI-84 Plus and TI-84 Plus CE. It also shows how to use the graphing screen, table, and algebraic rules to verify your answer.
What Are Domain and Range?
The domain is the set of input values that a function accepts. On a graph, domain is read from left to right along the x-axis.
The range is the set of output values that a function produces. On a graph, range is read from bottom to top along the y-axis.
For example, consider:
You can enter any real number for x. The smallest value of is 0.
Therefore:
- Domain: all real numbers
- Range:
The TI-84 can help you see these characteristics by graphing the function and examining its values.
How to Enter a Function on a TI-84
Before finding domain and range, enter the function into the calculator.
- Turn on the TI-84.
- Press the Y= button.
- Enter the function beside Y1.
- Press GRAPH.
- Adjust the viewing window if necessary.
For example, enter:
Press GRAPH to display the parabola.
The graph gives you a visual representation of the function. You can then determine how far the graph extends horizontally and vertically.
How to Find the Domain on a TI-84
The graph provides a useful way to investigate the domain. The domain corresponds to the x-values where the graph exists.
Start by entering the function in the Y= menu. Then press GRAPH.
Use the arrow keys to move the cursor along the graph. The x-coordinate displayed by the TI-84 represents an input value.
For a function such as:
the graph continues to the left and right without an endpoint or break. This indicates that every real x-value is allowed.
The domain is:
However, a graph alone should not be used as the only method for every function. The calculator screen displays only a limited section of the coordinate plane. You should also examine the function's algebraic restrictions.
How to Find the Range on a TI-84
The range consists of all y-values produced by the function.
After graphing the function, examine how far the graph extends vertically.
For:
the graph has a lowest point at . The graph does not produce negative y-values.
Therefore:
You can use the TRACE function to move across the graph and observe the changing y-values.
Press:
- GRAPH
- TRACE
- Use the left and right arrow keys.
The calculator displays coordinate values for points along the graph.
Using the TI-84 Table to Find Domain and Range
The TI-84 table provides another method for examining function values.
After entering a function:
- Press 2nd.
- Press WINDOW to open TBLSET.
- Set TblStart to the x-value where you want the table to begin.
- Set ΔTbl to the desired interval.
- Press 2nd.
- Press GRAPH to open the table.
The table displays x-values and corresponding y-values.
For example, with:
the table may show values such as:
| x | y |
|---|---|
| -3 | 9 |
| -2 | 4 |
| -1 | 1 |
| 0 | 0 |
| 1 | 1 |
| 2 | 4 |
| 3 | 9 |
The table helps you understand the relationship between domain and range. However, it shows selected values rather than every possible real number.
Finding the Domain of a Square Root Function
Square root functions have an important domain restriction.
Consider:
The expression inside a square root cannot be negative when working with real numbers.
Set the expression inside the square root greater than or equal to zero:
Therefore:
The domain is:
Enter the function into Y1:
Y1=sqrt(X-2)
Press GRAPH.
The graph starts at and continues toward the right. This visual pattern confirms the domain restriction.
The range is:
The TI-84 graph helps you identify the starting point and direction of the graph.
Finding the Domain of a Rational Function
Rational functions contain variables in denominators.
Consider:
The denominator cannot equal zero.
Set the denominator equal to zero:
So:
is excluded from the domain.
The domain is:
Enter the function as:
Y1=1/(X-3)
When you graph the function, you will see a vertical asymptote at .
The TI-84 graph can help you locate the excluded x-value. However, the algebraic equation confirms the exact restriction.
Finding Domain and Range of a Linear Function
Linear functions usually have simple domain and range values.
Consider:
There are no denominators, square roots, or logarithms restricting x.
The domain is:
Because the line continues upward and downward without an endpoint, the range is also:
Enter:
Y1=2X+5
Then press GRAPH.
The graph shows a straight line extending in both directions.
Finding Domain and Range of a Quadratic Function
Quadratic functions require you to examine the vertex.
Consider:
The parabola opens upward. Its lowest y-value is:
Therefore:
- Domain:
- Range:
The TI-84 can help you locate the minimum point.
Press:
- 2nd
- TRACE
- Select minimum
- Move the cursor near the left side of the minimum.
- Press ENTER.
- Move the cursor near the right side.
- Press ENTER again.
- Press ENTER to calculate the minimum.
The calculator displays the coordinates of the minimum point. The y-coordinate gives the lower boundary of the range.
How to Find Domain and Range From a Graph
You can also use the TI-84 to analyze a graph that represents a function.
Look at the graph horizontally to determine the domain. Ask:
Which x-values have points on the graph?
Then look vertically to determine the range. Ask:
Which y-values have points on the graph?
Pay attention to:
- Open circles
- Closed circles
- Endpoints
- Holes
- Vertical asymptotes
- Horizontal asymptotes
- Breaks in the graph
- Square root boundaries
A closed endpoint means the value is included. An open endpoint means the value is excluded.
How to Use TRACE for Domain and Range
The TRACE button lets you inspect coordinates on a graph.
Press TRACE, then use the arrow keys.
The TI-84 displays the current x and y coordinates. You can use these coordinates to investigate important parts of the graph.
TRACE is especially useful for:
- Finding endpoints
- Checking function values
- Locating turning points
- Examining discontinuities
- Checking approximate coordinates
TRACE does not automatically calculate the complete domain or range. You must interpret the graph and mathematical restrictions.
Adjusting the TI-84 Window
Sometimes the default graphing window does not show enough of the function.
Press WINDOW to change:
- Xmin
- Xmax
- Xscl
- Ymin
- Ymax
- Yscl
For example, you can set:
Xmin=-10
Xmax=10
Ymin=-10
Ymax=10
Then press GRAPH.
A larger viewing window can help you see endpoints, asymptotes, turning points, and other features.
The ZOOM menu also provides useful graphing options. Press ZOOM and select an appropriate viewing option.
Domain and Range Notation on a TI-84
The TI-84 can display numerical values, but you normally write the final domain and range using mathematical notation.
Common notation includes:
Interval notation
means all real numbers.
means 2 and every number greater than 2.
Inequality notation
You can also write:
for a domain restriction.
For range:
means the function produces zero and positive values.
Parentheses indicate that an endpoint is excluded. Brackets indicate that an endpoint is included.
Common Mistakes When Finding Domain and Range
Several mistakes can produce incorrect answers.
Mistake 1: Reading only the visible graph.
The TI-84 displays a limited window. A graph may continue beyond the screen.
Mistake 2: Ignoring undefined values.
A denominator equal to zero creates a domain restriction.
Mistake 3: Treating an open circle as included.
An open circle means the endpoint is excluded.
Mistake 4: Using table values as the complete domain.
A table displays selected x-values. It does not list every real number.
Mistake 5: Forgetting square root restrictions.
The expression inside an even root must be nonnegative when working with real numbers.
Mistake 6: Confusing x-values and y-values.
Domain describes x-values. Range describes y-values.
Quick Method for Finding Domain and Range on a TI-84
Use this process when solving most domain and range problems:
- Press Y=.
- Enter the function.
- Press GRAPH.
- Adjust the WINDOW if needed.
- Use TRACE to inspect important points.
- Use TABLE to check selected x and y values.
- Identify domain restrictions from the equation.
- Identify the lowest, highest, or restricted y-values.
- Write the domain using interval or inequality notation.
- Write the range using interval or inequality notation.
The TI-84 works best as a visual and numerical checking tool. Algebraic analysis remains important because the graph cannot display an infinite domain or range completely.
Frequently Asked Questions
Can a TI-84 find domain and range automatically?
No. The TI-84 does not have a single command that automatically returns the complete domain and range for every function. You can use graphing, tables, TRACE, and algebraic analysis to determine them.
How do I find the domain from a TI-84 graph?
Look at the x-values where the graph exists. Check endpoints, holes, breaks, and vertical asymptotes. Then verify any restrictions from the equation.
How do I find the range from a TI-84 graph?
Look at the y-values produced by the graph. Check for minimum values, maximum values, endpoints, holes, and asymptotes.
Can the TI-84 show domain restrictions?
The TI-84 can show where a graph exists, but you should identify exact restrictions from the mathematical equation. This is especially important for rational, square root, and logarithmic functions.
What is the difference between domain and range?
Domain contains the possible x-values of a function. Range contains the possible y-values of a function.
Can I use TRACE to find the range?
Yes. TRACE lets you inspect y-values at different x-values. However, TRACE does not automatically provide the complete range.
Why does my TI-84 graph not show the entire domain?
The graphing window covers only a selected interval. Change Xmin and Xmax through the WINDOW menu or use the ZOOM menu to view a larger portion of the graph.
How do I find the range of a parabola on a TI-84?
Graph the parabola and locate its vertex. If the parabola opens upward, the vertex gives the minimum y-value. If it opens downward, the vertex gives the maximum y-value.
🧮 Try the TI-84 Calculator Online — It's Free!
Put your knowledge to practice with our free browser-based TI-84 Plus CE emulator. No downloads, no sign-up required.
Open Calculator →